

Seasonal Business Data: Pop-Up Shops and Markets
Seasonal business data helps retailers understand customer demand, sales trends, inventory requirements, and location performance during temporary retail events. From pop-up shops and holiday markets to festivals and seasonal campaigns, analysing real-time data enables faster decisions, better resource planning, and improved customer experiences. By tracking sales, foot traffic, inventory, customer behaviour, and post-event performance, retailers can identify what works and use those insights to plan more successful seasonal strategies.


 11 min read
 Share
Share
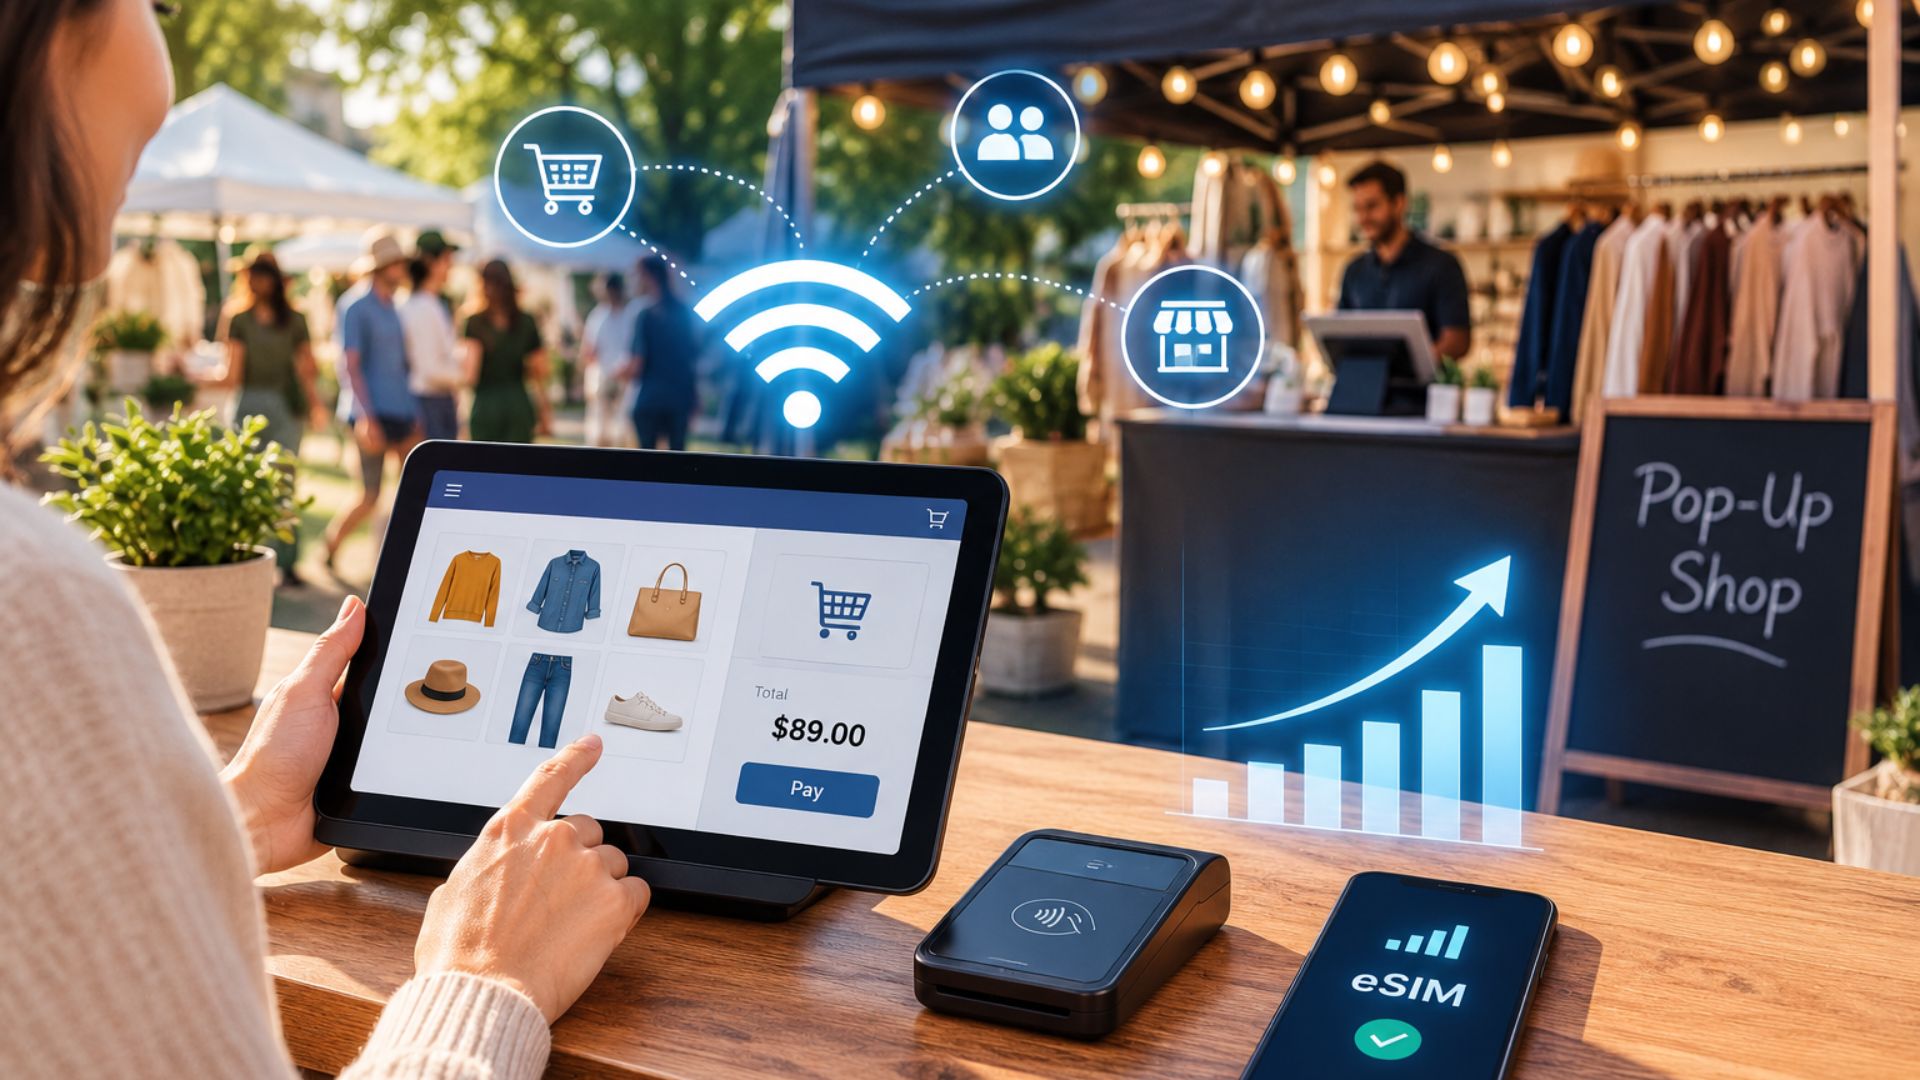
Seasonal business data gives retailers a clearer view of what customers buy, when demand rises, which locations perform best, and how temporary stores affect overall sales. For pop-up shops, holiday markets, farmers’ markets, and event-based retail, this data can help businesses make faster decisions without committing to a permanent storefront. In 2026, seasonal retail is becoming more data-driven, and reliable connectivity is a key part of making that data useful.
A temporary retail location may operate for a few days or several weeks. Yet it still needs many of the same systems as a permanent store. Staff need connected POS terminals. Customers expect fast card payments. Inventory systems need current stock information. Retail teams may also collect customer details, process online orders, and monitor sales across several locations.
Without reliable data and connectivity, a seasonal retail operation can quickly become difficult to manage.

Keep Every Seasonal Store Connected
Reliable eSIM connectivity for pop-up shops and markets.
What Is Seasonal Business Data?
Seasonal business data is information collected and analysed during a specific period when customer demand changes because of holidays, weather, events, tourism, local markets, or other seasonal factors.
For retailers, this can include:
- Sales by day, hour, and location
- Product demand
- Inventory levels
- Customer foot traffic
- Conversion rates
- Average order value
- Payment transactions
- Customer sign-ups
- Promotional performance
- Online sales after a pop-up event
- Staff performance
- Location-specific customer behaviour
This information helps retailers answer practical questions.
- Which products sell best during a particular season?
- Which market or event attracts the most buyers?
- When should inventory be replenished?
- Is a temporary location generating enough revenue to justify returning next year?
The answers can turn a short-term retail experiment into a repeatable business strategy.
Why Seasonal Data Matters for Pop-Up Retail?
Pop-up retail is designed around a temporary opportunity. A retailer may open a store for a holiday period, launch a product at an event or test demand in a new market.
Shopify defines a pop-up shop as a temporary retail space that can operate from a single day to several months. Its 2026 guidance also recommends measuring metrics such as foot traffic, conversion rate, average order value, customer sign-ups, customer acquisition cost and post-event online sales.
That makes data more than a reporting tool. It becomes part of the retail strategy.
For example, imagine a clothing retailer operates three holiday pop-ups:
- Location A generates high foot traffic but low conversion.
- Location B has fewer visitors but a higher average order value.
- Location C generates moderate sales but produces many new customer sign-ups.
Looking only at total revenue could make Location A appear to be the winner. Looking at the full set of seasonal business data may show that Location B is more profitable and Location C has greater long-term customer value.
This is why temporary retail should be measured beyond daily sales.
What Data Should Seasonal Retailers Track?
A useful seasonal business data strategy starts with a small set of practical metrics.
1. Sales Data
Track total sales by:
- Date
- Time
- Location
- Product
- Product category
- Payment method
- Promotion
This helps identify peak periods and best-selling products.
If a market receives most of its customers between 4 p.m. and 8 p.m., for example, the retailer can schedule more staff and make sure high-demand products are available during those hours.
2. Foot Traffic
Foot traffic shows how many people visit a temporary retail location.
High foot traffic with low sales can indicate a problem with:
- Product selection
- Pricing
- Store layout
- Signage
- Customer experience
- Staff engagement
Low traffic with strong conversion can suggest that the location attracts a smaller but more relevant audience.
3. Conversion Rate
Conversion rate measures how many visitors become customers.
A simple formula is:
Conversion Rate = Number of Purchases ÷ Number of Visitors × 100
Tracking this metric across seasonal locations can help retailers compare markets and events more accurately.
4. Average Order Value
Average order value, or AOV, shows how much customers spend per transaction.
A retailer can compare AOV across different seasons and locations to determine where customers are more likely to make larger purchases.
5. Inventory Data
Seasonal demand can change quickly.
A product that sells slowly on Monday could become the best seller on Saturday because of a local event, weather change or holiday promotion.
Real-time inventory data helps retailers:
- Monitor stock levels
- Identify fast-moving products
- Reduce stockouts
- Move inventory between locations
- Plan future seasonal orders
6. Customer Data
A pop-up should not only generate one-time sales.
With appropriate customer consent, retailers can collect email addresses, SMS subscriptions, loyalty registrations and other first-party customer information.
This creates an opportunity to continue the relationship after the temporary store closes.
7. Post-Event Sales
One of the most valuable measurements is what happens after the pop-up ends.
Did website traffic increase?
Did customers from the event purchase again?
Did social engagement increase?
Did customers from that location become repeat buyers?
Shopify recommends tracking online sales within the pop-up’s geographic area for several weeks after the event to identify potential sales lift.
Seasonal Business Data Starts With Reliable Connectivity
Data is only useful when retail systems can send and receive it.
This becomes especially important when a retailer operates outside a traditional store.
A seasonal business may set up:
- A market stall
- A shopping-centre kiosk
- A holiday shop
- A festival booth
- A temporary showroom
- A mobile retail unit
- An event store
- A beach or resort pop-up
These locations may not have reliable fixed broadband.
Yet retailers still need to run cloud-based systems, accept card payments and keep operations connected.
This creates a unique connectivity challenge.
Ericsson/Cradlepoint notes that temporary retail environments can range from a single-person booth at a farmers’ market to a large temporary store, with cellular networking providing a flexible option for changing retail locations.
For retailers, mobile connectivity can therefore become part of the seasonal operating model rather than an afterthought.
Power Smarter Pop-Up Retail
Keep POS and retail devices connected wherever you operate.
How eSIM Data Plans Support Seasonal Retail?
An eSIM can help retailers connect compatible devices without relying on a physical SIM card for every temporary deployment.
For a retailer running multiple seasonal locations, this can simplify connectivity across:
- POS terminals
- Tablets
- Mobile devices
- Inventory scanners
- Digital signage
- Routers
- Staff devices
- Connected retail equipment
With a business eSIM setup, teams can deploy connectivity based on where and when it is needed.
For example, a retailer might run:
December: Holiday market in New York
January: Winter event in Chicago
February: Trade show in Las Vegas
Instead of treating each location as a completely separate connectivity project, the business can use a managed mobile data approach to support temporary deployments.
This is particularly useful when retail teams need to move quickly.
Why Reliable Connectivity Matters at Pop-Up Shops?
A temporary retail store has very little time to generate revenue.
A permanent store may have days or weeks to resolve operational issues. A two-day market does not.
If connectivity fails during peak hours, a retailer may experience:
- Failed card transactions
- Slow POS systems
- Delayed inventory updates
- Interrupted customer sign-ups
- Problems accessing cloud applications
- Disconnected staff devices
- Poor customer experiences
For this reason, connectivity should be tested before opening day.
Retailers should confirm:
- Which devices need internet access?
- How much data will each location use?
- What network coverage is available?
- What happens if the primary connection fails?
- Who manages the connection remotely?
- How will data usage be monitored?
- Can connectivity be activated quickly at another location?
Planning these details before launch can prevent avoidable disruption.
Seasonal Retail Data Can Improve Inventory Planning
Inventory is one of the biggest challenges in seasonal retail.
Too much stock can create markdowns after the season. Too little stock can result in missed sales during the busiest days.
Historical seasonal business data can help retailers identify patterns.
Suppose a retailer sold 500 units of a product during a holiday market in 2025. In 2026, the retailer can compare that result with:
- Foot traffic
- Weather
- Event attendance
- Price changes
- Promotions
- Product availability
- Day-of-week performance
The goal is not to assume that last year’s demand will repeat.
Instead, historical data becomes one input into a more informed forecast.
Modern retail forecasting can also combine seasonal patterns with external factors such as holidays, consumer prices, and weather. Research into retail forecasting has shown the value of incorporating these changing factors rather than relying only on historical sales.
Use Seasonal Data to Choose Better Locations
Location can determine the success of a pop-up. Retailers should compare more than rent.
Useful location-level metrics include:
| Metric | What it tells you |
| Foot traffic | Potential customer volume |
| Conversion rate | Quality of visitor traffic |
| AOV | Customer spending level |
| Revenue per day | Daily sales potential |
| Revenue per square foot | Space efficiency |
| Customer acquisition cost | Cost of gaining customers |
| Repeat purchases | Long-term customer value |
| Data usage | Connectivity requirements |
This creates a clearer picture of location performance.
A market with cheaper space may not be the better choice if it produces fewer qualified customers.
Seasonal Retail Is Becoming More Important
Seasonal and event-driven retail continues to attract significant consumer spending. The National Retail Federation reported that U.S. holiday sales for November and December 2025 grew 4.1% from the previous year and reached just over $1 trillion. NRF had forecast $1.01 trillion to $1.02 trillion in holiday sales, showing the scale of seasonal demand in the U.S. retail market. The opportunity is not limited to Christmas.
Retailers can build temporary strategies around:
- Back-to-school
- Halloween
- Valentine’s Day
- Mother’s Day
- Father’s Day
- Summer tourism
- Sporting events
- Music festivals
- Local fairs
- Farmers’ markets
- Cultural events
- Product launches
Each event creates a different customer and demand pattern. The better retailers capture this information, the easier it becomes to improve the next seasonal campaign.
A Simple Seasonal Business Data Framework
Retail teams can use a five-step process.
Step 1: Define the Goal
Decide what the temporary location is designed to achieve.
Is the goal:
- Direct sales?
- Customer acquisition?
- Product testing?
- Brand awareness?
- Market expansion?
- Inventory clearance?
The goal determines which metrics matter most.
Step 2: Connect Every Critical Device
Identify every device that needs connectivity before the event begins.
This includes POS terminals, tablets, scanners, routers and staff devices.
Step 3: Capture Data During the Event
Monitor sales, traffic, inventory and customer activity as the event runs.
Real-time information allows managers to respond while there is still time to act.
Step 4: Compare Locations and Events
Do not judge success from total sales alone.
Compare conversion, AOV, customer acquisition cost, inventory movement and post-event sales.
Step 5: Use the Results for the Next Season
Turn the findings into an action plan.
The next event should not start from zero.
Historical seasonal business data can help determine where to go, what to stock, how much connectivity is required and how many staff members may be needed.
Seasonal Business Data Checklist for Retailers
Before launching a pop-up or market location, retailers should ask:
- Do all critical devices have reliable connectivity?
- Is the POS system tested?
- Is enough mobile data available for the expected usage?
- Can inventory data update in real time?
- Can customer information be captured with proper consent?
- Are peak shopping hours identified?
- Are best-selling products stocked?
- Is there a backup connectivity plan?
- Are sales and customer metrics being tracked?
- Will post-event online activity be measured?
These questions can turn a temporary retail operation into a measurable business experiment.
How Voye Data Pool Supports Seasonal Retail Connectivity?
Voye Data Pool helps businesses simplify mobile connectivity for teams and connected devices operating across locations. For retailers, this can be useful when seasonal operations require connectivity without the long-term commitment of traditional fixed internet. A retailer can use business eSIM connectivity to support temporary teams and devices across markets, events, and pop-up locations.
The value is simple: keep retail operations connected while the business moves with seasonal demand. When POS systems, staff devices, and other connected equipment can stay online, retailers can capture better data and make faster operational decisions.
The Future of Seasonal Retail Is Data-Driven
Pop-up shops and seasonal markets are no longer just short-term sales opportunities. They can act as real-world testing environments. A retailer can test a new product, measure customer demand, compare locations, and collect insights before making a larger investment. That makes seasonal business data valuable beyond the event itself.
The winning approach is to connect three things:
Customer demand + operational data + reliable connectivity
When these work together, retailers can make smarter decisions about inventory, locations, staffing, promotions, and future expansion. For seasonal retail in 2026, the goal should not simply be to open a temporary store. It should be to make every temporary location measurable, connected, and useful for the next business decision.
Turn Retail Data Into Better Decisions
Flexible eSIM connectivity for seasonal retail operations.
Final Takeaway
Seasonal retail moves fast. Markets open, events end, and customer demand can change within hours. That makes timely data essential.
By tracking sales, customer behaviour, inventory, and location performance-and supporting those systems with reliable mobile connectivity-retailers can turn temporary pop-ups into valuable sources of business intelligence.
For retailers planning seasonal operations, the opportunity is not just to sell more during a short window. It is to collect better data, learn faster, and use those insights to build a stronger retail strategy for the next season.